
Thermography Scanning Test
Introduction to Thermography:
Thermography is a predictive maintenance technique that can be used to monitor the condition of plant machinery, structures, and systems. It uses instrumentation designed to monitor the emission of infrared energy (i.e., temperature) to determine operating condition. By detecting thermal anomalies (i.e., areas that are hotter or colder than they should be), an experienced surveyor can locate and define incipient problems within the plant.
Infrared Technology:
Infrared technology is predicated on the fact that all objects with a temperature above absolute zero emit energy or radiation. Infrared radiation is one form of this emitted energy. Infrared emissions, or below red, are the shortest wavelengths of all radiated energy and are invisible without special instrumentation. The intensity of infrared radiation from an object is a function of its surface temperature; however, temperature measurement using infrared methods is complicated because three sources of thermal energy can be detected from any object: energy emitted from the object itself, energy reflected from the object, and energy transmitted by the object. Only the emitted energy is important in a predictive maintenance program. Reflected and transmitted energies will distort raw infrared data. Therefore, the reflected and transmitted energies must be filtered out of acquired data before a meaningful analysis can be completed.
Variations in surface condition, paint, or other protective coatings and many other variables can affect the actual emissivity factor for plant equipment. In addition to reflected and transmitted energy, the user of thermo-graphic techniques must also consider the atmosphere between the object and the measurement instrument. Water vapor and other gases absorb infrared radiation. Airborne dust, some lighting, and other variables in the surrounding atmosphere can distort measured infrared radiation. Because the atmospheric environment is constantly changing, using thermo-graphic techniques requires extreme care each time infrared data is acquit.
Thermography and Predictive Maintenance (PdM):
Infrared thermo-graphic cameras are the first line of defense in a predictive maintenance program which makes possible to quickly measure and compare heat signatures for each piece of equipment on the inspection route, without disrupting operations. If the temperature is markedly different from previous readings, maintenance programs can be undertaken to iron out the anomalies.
Thermo-graphic PdM includes the following prime applications- monitor and measure bearing temperatures in large motors or other rotating equipment, identify “hot spots” in electronic equipment, identify leaks in sealed vessels, find faulty insulation in process pipes or other insulated processes, find faulty terminations in high power electrical circuits, locate overloaded circuit breakers in a power panel, identify fuses at or near their current rated capacity, identify problems in electrical switch gear, capture process temperature read.
Section B– Referenced Standards
American Society for Testing and Materials (ASTM E 1934 – 99a): Standard Guide for Examining Electrical and Mechanical Equipment with Infrared Thermography. National Fire Protection Association (NFPA 70b – 20.17): Infrared Inspection. American National Standard (ANSI/NETA MTS-2007) – Standard for Maintenance Testing Specifications for Electrical Power Distribution Equipment and Systems
Section C – Inspection Methodology
In addition to the referenced standards, the following method statements are being carried out in order to make quantitative thermal imaging and accuracy of inspection data results. Equipment Used:
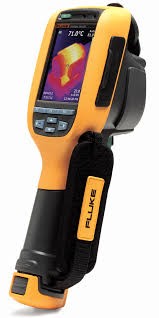
- Fluke Ti100
- PC notebook (for extra storage of images) Digital Camera
- Method Statements:
- Discuss with qualified site technical assistance about the inspection services detail planning prior to conduct thermal scanning.
- Obtain authorization and by safety access route leading of qualified technical assistance to inspection area in terms of efficiency.
- Inspect the equipment/panels/machines from vantage point to vantage point.
- Provision of actual load (phase by phase) of circuit by qualified site technical assistance as required by Infrared Thermograph.
- Record date, time and the Location / Sections to be inspected. Record the Ambient Temperature.
- Record the distance of equipment to IR camera.
- Take quantitative IR images associate with its digital image to the area / location / anomaly of the equipment being inspected.
- Take digital images for that equipment where installed at unexposed area, if any.
What is Thermography Test.
Thermography test measures all type Electric and any other structure surface temperatures by using infrared Image video and still Thermography cameras. These tools see light that is in the heat and cool spectrum. Thermography Images on the video or film record the temperature variations of the Any electrical Structure skin Like. Transformer, Sub-Station, DB Board etc.
Thermography Test Standards
(A) Bangladesh National Building Code 2006 –Part-8, Chapter-2.
(B) Bangladesh Electricity Rules 1937 – Appropriate Sections.
(C) NETA MTS-2011 – Appropriate Sections
(D) ASTM E1934‐99a Standard Guide for Examining Electrical and Mechanical Equipment
With Infrared Thermography
(E) Alliance Fire Safety Standard – Appropriate Sections
Instrument Details
Name of Instrument | Thermal Imager |
Manufacturer | Fluke Thermography |
Model Number | Ti-100 |
Thermography Test Evaluating Results Standards.
As per NETA Maintenance Testing Specifications for Electrical Equipment (Tablet: 100.18)
Priority | Delta T between Similar Components Under Similar Load | Delta T Over ambient Air Temperature | Recommend Action |
00 | 1 to 3 °C | 1 to 10°C | Possible Deficiency Warrants Investigation |
01 | 4 to 15 °C | 11 to 20°C | Indicates Probable Deficiency Repair as time Permits |
02 | — | 21 to 40°C | Monitor Until Corrective Measures Can be Accomplished |
03 | > 15 °C | >40°C | Major Discrepancey; Repair Immediately |
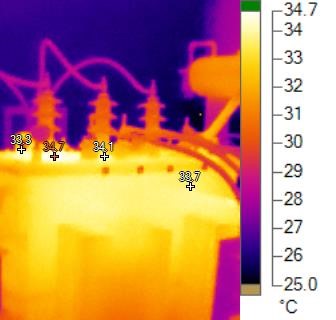
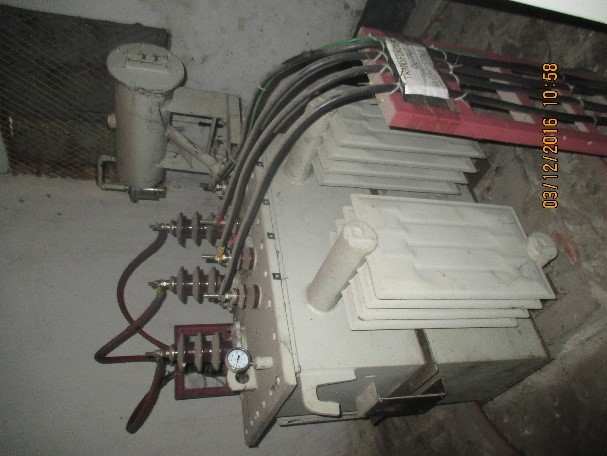
Image Info:
Image Range | 25.0°C to 34.7°C |
Camera Model | Ti100 |
IR Sensor Size | 120 x 160 |
Image Time | 12/3/2016 11:26:09 AM |
Calibration Range | -10.0°C to 250.0°C |
Main Image Markers
Name | Temperature | Category | Probable Cause | Recommendation |
Hot | 34.7°C | Category-1 | Hot Point is found but probable cause not identified at the time of scanning. | Hot Point is found but probable cause not identified at the time of scanning. |
P0 | 33.3°C | Category-1 | ||
P1 | 34.1°C | Category-1 | ||
P2 | 33.7°C | Category-1 |
12/3/2016 11:36:50 AM | Location | Substation/GF | |
Equipment | LT Panel | Equipment Name: | LT Panel |
Ambient Air Temp: | 25.5°C | Wind Speed | N/A |
Load (%) | 45 | Max Rated Load: | 315A |
Camera Manufacturer | Fluke Thermography | Camera: | Ti100-15030489 |
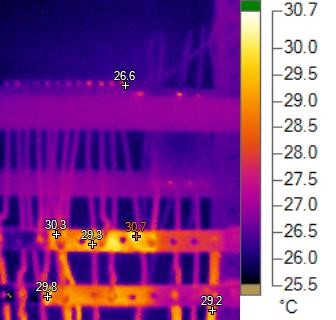
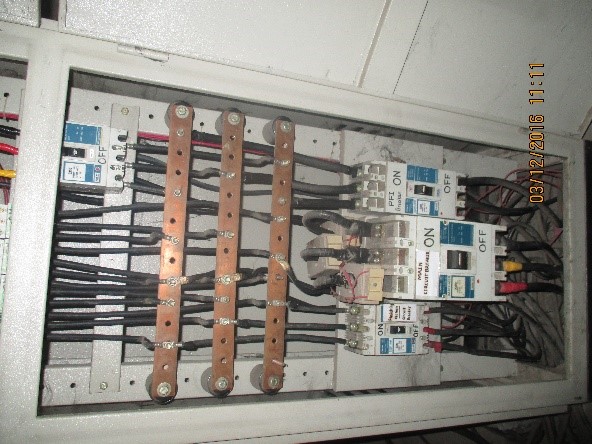
Image Info
Image Range | 25.5°C to 30.7°C |
Camera Model | Ti100 |
IR Sensor Size | 120 x 160 |
Image Time | 12/3/2016 11:36:50 AM |
Calibration Range | -10.0°C to 250.0°C |
Main Image Markers
Name | Temperature | Category | Probable Cause | Recommendation |
Hot | 30.7°C | Category-1 | Loose connection on circuit breaker terminal. Wire are not seized. | Checking and observation required. Check cable connection for possible loose connection & tighten where required. |
P0 | 30.3°C | Category-1 | ||
P1 | 29.8°C | Category-1 | ||
P2 | 29.3°C | Category-1 | ||
P3 | 29.2°C | Category-1 | ||
P4 | 26.6°C | Category-1 |